Trying out GHC compact regions for improved latency (Pusher case study).
(I have rambled yesterday about .Internal modules in libraries and why you should use them but I messed up the RSS feed: if you haven’t seen the post but are a library author, you might want to check it out here.)
A couple of years ago, Pusher published a quite good blog post about how GHC garbage collection time pauses scale with size of the working set. I will not re-iterate the blog post, you should go read it.
Ultimately in the post the authors went to StackOverflow for help/confirmation of their findings.
What was of particular interest to me is that the accepted answer mentions an up-coming feature called compact regions which could help. As it happens, today’s the future and the feature has been in GHC since 8.2.x. Very roughly, it allows you to put data in a contiguous memory region with some restrictions. One of these restrictions is that this data can not have outgoing pointers. This is very useful because if it has no outgoing pointers then we know it’s not holding onto any GC roots and doesn’t have to be traversed or copied by the GC. I very highly recommend that you read the paper: I was certainly very impressed. I also didn’t know the original use-case was to send unserialised data over network and GC latency seems a bit more secondary. There are more cool things you can do like write the region out to disk and read it back later which can potentially save you a lot of time that you might have had to spend on (de)serialisation: very inefficient if you’re running the binary multiple times.
Let’s try using compact regions for Pusher’s use-case and check if it can help. This is an exploratory exercise for me, it could fail horribly and I will be discovering things as we go along.
Replicating reported results
Pusher’s reduced code was as follows.
module Main (main) where

import qualified Control.Exception as Exception
import qualified Control.Monad as Monad
import qualified Data.ByteString as ByteString
import qualified Data.Map.Strict as Map

data Msg = Msg !Int !ByteString.ByteString

type Chan = Map.Map Int ByteString.ByteString

message :: Int -> Msg
message n = Msg n (ByteString.replicate 1024 (fromIntegral n))

pushMsg :: Chan -> Msg -> IO Chan
pushMsg chan (Msg msgId msgContent) =
  Exception.evaluate $
    let
      inserted = Map.insert msgId msgContent chan
    in
      if 200000 < Map.size inserted
      then Map.deleteMin inserted
      else inserted

main :: IO ()
main = Monad.foldM_ pushMsg Map.empty (map message [1..1000000])
On my machine this gives me the following numbers:
[nix-shell:/tmp]$ ghc -O2 -optc-O3 -fforce-recomp Main.hs && ./Main +RTS -s
[1 of 1] Compiling Main             ( Main.hs, Main.o )
Linking Main ...
   2,996,460,128 bytes allocated in the heap
     365,809,560 bytes copied during GC
     235,234,760 bytes maximum residency (12 sample(s))
      61,966,904 bytes maximum slop
             601 MB total memory in use (0 MB lost due to fragmentation)

                                     Tot time (elapsed)  Avg pause  Max pause
  Gen  0      3150 colls,     0 par    0.255s   0.255s     0.0001s    0.0222s
  Gen  1        12 colls,     0 par    0.001s   0.001s     0.0001s    0.0001s

  INIT    time    0.000s  (  0.000s elapsed)
  MUT     time    0.461s  (  0.461s elapsed)
  GC      time    0.256s  (  0.256s elapsed)
  EXIT    time    0.017s  (  0.017s elapsed)
  Total   time    0.734s  (  0.734s elapsed)

  %GC     time      34.9%  (34.9% elapsed)

  Alloc rate    6,496,221,499 bytes per MUT second

  Productivity  65.1% of total user, 65.1% of total elapsed
Well, these aren’t quite the same. I’m using GHC 8.2.2 while the author used 7.10.2. I also guess that my machine might be faster. That’s okay, I will just increase the maximum map size to 500000 elements and double the number of messages.
diff --git a/tmp/Main_orig b/tmp/Main.hs
index 4ffce03..e507d9f 100644
--- a/tmp/Main_orig
+++ b/tmp/Main.hs
@@ -18,9 +18,9 @@ pushMsg chan (Msg msgId msgContent) =
     let
       inserted = Map.insert msgId msgContent chan
     in
-      if 200000 < Map.size inserted
+      if 500000 < Map.size inserted
       then Map.deleteMin inserted
       else inserted

 main :: IO ()
-main = Monad.foldM_ pushMsg Map.empty (map message [1..1000000])
+main = Monad.foldM_ pushMsg Map.empty (map message [1..2000000])[nix-shell:/tmp]$ ghc -O2 -optc-O3 -fforce-recomp Main.hs && ./Main +RTS -s
[1 of 1] Compiling Main ( Main.hs, Main.o )
Linking Main ...
6,186,436,048 bytes allocated in the heap
773,945,776 bytes copied during GC
588,034,760 bytes maximum residency (13 sample(s))
154,896,792 bytes maximum slop
1499 MB total memory in use (0 MB lost due to fragmentation)
Tot time (elapsed) Avg pause Max pause
Gen 0 6499 colls, 0 par 0.567s 0.567s 0.0001s 0.0573s
Gen 1 13 colls, 0 par 0.001s 0.001s 0.0001s 0.0001s
INIT time 0.000s ( 0.000s elapsed)
MUT time 0.990s ( 0.990s elapsed)
GC time 0.568s ( 0.568s elapsed)
EXIT time 0.038s ( 0.038s elapsed)
Total time 1.596s ( 1.596s elapsed)
%GC time 35.6% (35.6% elapsed)
Alloc rate 6,250,218,761 bytes per MUT second
Productivity 64.4% of total user, 64.4% of total elapsedOkay, I get a lot more total memory used but the pause is now very similar to original problem. Let’s work with this.
One important thing I want to mention is that the above code is obviously somewhat contrived and not optimal. Better (faster, less latency) answers were given on the SO answer but it’s not the point of this exercise.
First attempt at compacting data
Let’s use the compact package to put the working set (message map) in a compact region and see what happens. On first attempt we get an error:
Well, that’s a problem. Haddock helpfully informs us why
Pinned ByteArray# objects cannot be compacted. This is for a good reason: the
memory is pinned so that it can be referenced by address (the address
might be stored in a C data structure, for example), so we can't make
a copy of it to store in the Compact.
Okay, let’s use ShortByteString instead which doesn’t use pinned memory.
module Main (main) where

import qualified Control.Exception as Exception
import qualified Control.Monad as Monad
import qualified Data.ByteString as ByteString
import qualified Data.ByteString.Short as ByteString
import qualified Data.Map.Strict as Map

data Msg = Msg !Int !ByteString.ShortByteString

type Chan = Map.Map Int ByteString.ShortByteString

message :: Int -> Msg
message n = Msg n (ByteString.toShort $ ByteString.replicate 1024 (fromIntegral n))

pushMsg :: Chan -> Msg -> IO Chan
pushMsg chan (Msg msgId msgContent) =
  Exception.evaluate $
    let
      inserted = Map.insert msgId msgContent chan
    in
      if 500000 < Map.size inserted
      then Map.deleteMin inserted
      else inserted

main :: IO ()
main = Monad.foldM_ pushMsg Map.empty (map message [1..2000000])
Linking Main_short ...
8,298,436,048 bytes allocated in the heap
8,157,334,544 bytes copied during GC
560,033,704 bytes maximum residency (18 sample(s))
122,683,480 bytes maximum slop
1748 MB total memory in use (0 MB lost due to fragmentation)
Tot time (elapsed) Avg pause Max pause
Gen 0 9156 colls, 0 par 1.511s 1.511s 0.0002s 0.1852s
Gen 1 18 colls, 0 par 0.002s 0.002s 0.0001s 0.0002s
INIT time 0.000s ( 0.000s elapsed)
MUT time 0.872s ( 0.872s elapsed)
GC time 1.512s ( 1.513s elapsed)
EXIT time 0.037s ( 0.037s elapsed)
Total time 2.422s ( 2.422s elapsed)
%GC time 62.4% (62.4% elapsed)
Alloc rate 9,512,524,179 bytes per MUT second
Productivity 37.6% of total user, 37.6% of total elapsedDue to the additional overheads our pauses are through the roof. Let’s go back to original numbers of 200k and million messages:
Linking Main_short ...
   4,052,460,128 bytes allocated in the heap
   4,110,484,224 bytes copied during GC
     224,033,704 bytes maximum residency (18 sample(s))
      49,079,384 bytes maximum slop
             700 MB total memory in use (0 MB lost due to fragmentation)

                                     Tot time (elapsed)  Avg pause  Max pause
  Gen  0      4477 colls,     0 par    0.734s   0.735s     0.0002s    0.0717s
  Gen  1        18 colls,     0 par    0.002s   0.002s     0.0001s    0.0002s

  INIT    time    0.000s  (  0.000s elapsed)
  MUT     time    0.416s  (  0.416s elapsed)
  GC      time    0.736s  (  0.736s elapsed)
  EXIT    time    0.014s  (  0.014s elapsed)
  Total   time    1.166s  (  1.166s elapsed)

  %GC     time      63.1%  (63.1% elapsed)

  Alloc rate    9,746,445,658 bytes per MUT second

  Productivity  36.9% of total user, 36.9% of total elapsed
OK, let’s work with this.
Second attempt at compacting data
Now that we’re back to original figures (ish) we can actually compact data. Let’s try a naive approach: stick the whole map into a compact region:
module Main (main) where

import qualified Control.Exception as Exception
import qualified Control.Monad as Monad
import qualified Data.ByteString as ByteString
import qualified Data.ByteString.Short as ByteString
import           Data.Compact (Compact)
import qualified Data.Compact as Compact
import qualified Data.Map.Strict as Map

data Msg = Msg !Int !ByteString.ShortByteString

type Chan = Map.Map Int ByteString.ShortByteString

message :: Int -> Msg
message n = Msg n (ByteString.toShort $ ByteString.replicate 1024 (fromIntegral n))

pushMsg :: Compact Chan -> Msg -> IO (Compact Chan)
pushMsg chan (Msg msgId msgContent) = do
  let inserted = Map.insert msgId msgContent (Compact.getCompact chan)
  Compact.compactAdd chan $
    if 200000 < Map.size inserted
      then Map.deleteMin inserted
      else inserted

main :: IO ()
main = do
  startMap <- Compact.compact Map.empty
  Monad.foldM_ pushMsg startMap (map message [1..1000000])
Let’s run:
Linking Main_short ...
   7,006,681,216 bytes allocated in the heap
       7,154,440 bytes copied during GC
   1,869,743,096 bytes maximum residency (12 sample(s))
          29,352 bytes maximum slop
            2759 MB total memory in use (42 MB lost due to fragmentation)

                                     Tot time (elapsed)  Avg pause  Max pause
  Gen  0      4627 colls,     0 par    0.026s   0.026s     0.0000s    0.0000s
  Gen  1        12 colls,     0 par    0.000s   0.000s     0.0000s    0.0000s

  INIT    time    0.000s  (  0.000s elapsed)
  MUT     time    2.263s  (  2.264s elapsed)
  GC      time    0.026s  (  0.026s elapsed)
  EXIT    time    0.056s  (  0.056s elapsed)
  Total   time    2.345s  (  2.345s elapsed)

  %GC     time       1.1%  (1.1% elapsed)

  Alloc rate    3,095,601,467 bytes per MUT second

  Productivity  98.9% of total user, 98.9% of total elapsed
We completely eliminated the latency due to GC! We don’t really hold to any real data anymore so all the collections are extremely quick. What’s the catch?
Well, few things.
- Our program is twice as slow. We sacrificed throughput for latency. This was OK for Pusher guys but 2x is quite poor. If we could go faster that would be nice.
- Our total memory used is through the roof: 4x increase with 10x increase in resident memory. We’re only ever appending data to the region, never getting rid of data within it. This means our region is holding onto all 1000000 messages.
Can we try to do something more reasonable? What if we didn’t have a million messages but unbounded amount?
Memory usage
How do we lower the memory usage? We know where it’s coming from: the data in the region is never traced, never copied and therefore nothing is ever freed. The GC does not look in the region at all. To free the data in a region, we have to copy the live data we’re interested it out to a different region and free the region itself. This is pretty much exactly what GHC’s GC does so it’s like invoking the garbage collector manually for a region.
In order to copy out data to a new region, we simple use compact on the value and return the new region, letting the old region be freed. However we can’t (or rather, shouldn’t) do this on every new message: that’s like running garbage collection on every message that comes in. Notably, this is bad and I’m not even patient enough to wait for it to terminate:
pushMsg chan (Msg msgId msgContent) = do
  let inserted = Map.insert msgId msgContent (Compact.getCompact chan)
      newInserted = if 200000 < Map.size inserted
        then Map.deleteMin inserted
        else inserted
  Compact.compact newInserted
You may think we can improve this: we only need to collect when we throw away old data, right?
pushMsg chan (Msg msgId msgContent) = do
  let inserted = Map.insert msgId msgContent (Compact.getCompact chan)
  if 200000 < Map.size inserted
    then Compact.compact (Map.deleteMin inserted)
    else Compact.compactAdd chan inserted
Well, this is slightly better but only by some constant factor: after the buffer fills, we’re back to copying all the time.
What about a slightly more clever solution? We can specify how much memory we want to use and when we want to copy the data into a new region. That is, simply copy every n number of messages. In the worst case, we have 200k messages in buffer + n removed messages. This gives us more fine grained control lover exactly how much space we’re willing to allocate (at most) and how often copying happens. Most importantly, it allows us to reliably copy a known amount of data (up to a bound) which we can directly correlate to GC pause times! I’m going to use the fact that message IDs are sequential but you could trivially maintain own counter instead. Let’s make the code copy to a new region every n messages with n being configurable at command line.
pushMsg :: Int -> Compact Chan -> Msg -> IO (Compact Chan)
pushMsg collectEvery chan (Msg msgId msgContent) = do
  let inserted = Map.insert msgId msgContent (Compact.getCompact chan)
      newInserted = if 200000 < Map.size inserted
        then Map.deleteMin inserted
        else inserted
  if msgId `mod` collectEvery == 0
    then Compact.compact newInserted
    else Compact.compactAdd chan newInserted

main :: IO ()
main = getArgs >>= \case
  [ce] -> do
    startMap <- Compact.compact Map.empty
    Monad.foldM_ (pushMsg $! read ce) startMap (map message [1..1000000])
  _ -> error "usage: progname collectevery"
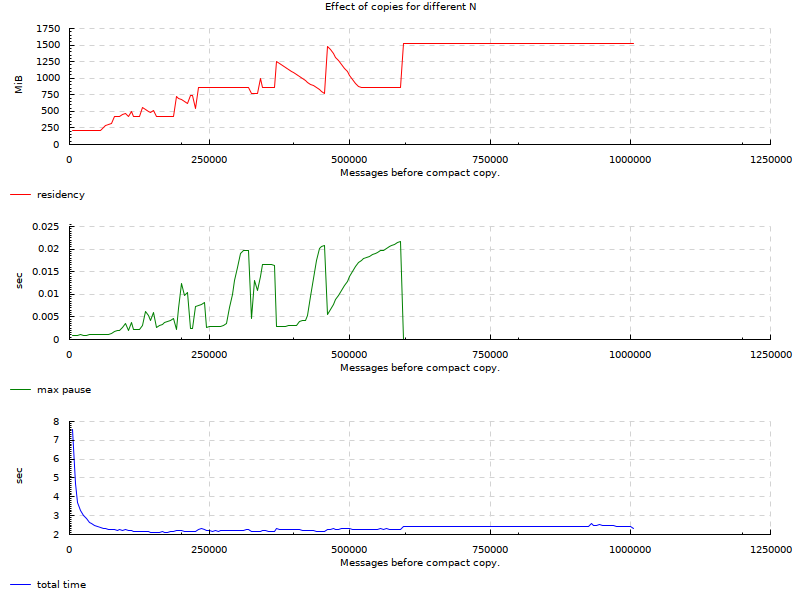
This means that for any n we give the program, it’s going to copy the data out into a new region. Let’s run it for every n from 5000 until 1005000: I’m not running it for less than 5000 because I don’t want to wait through all the copying and I’m running it over 1000000 to show a case where no copy happens.

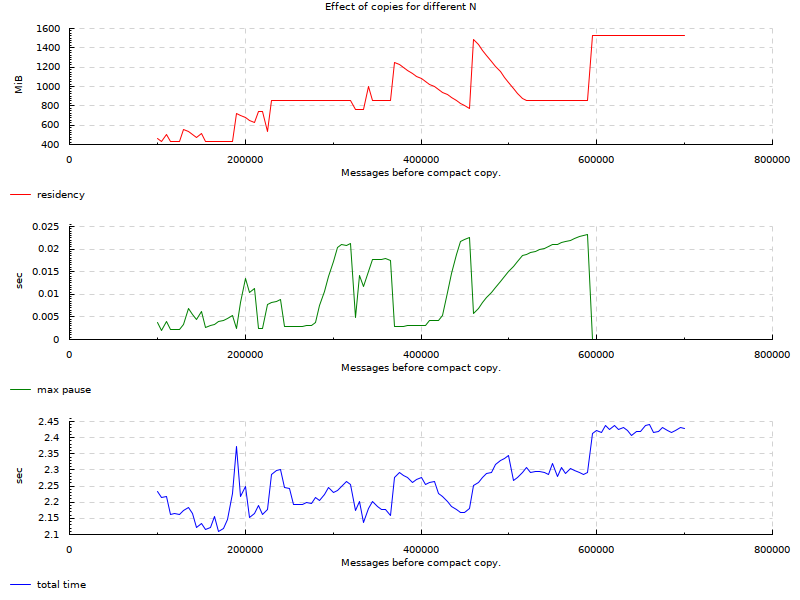
Here is a second run for smaller range of values to cut off the extremes (100k - 700k):

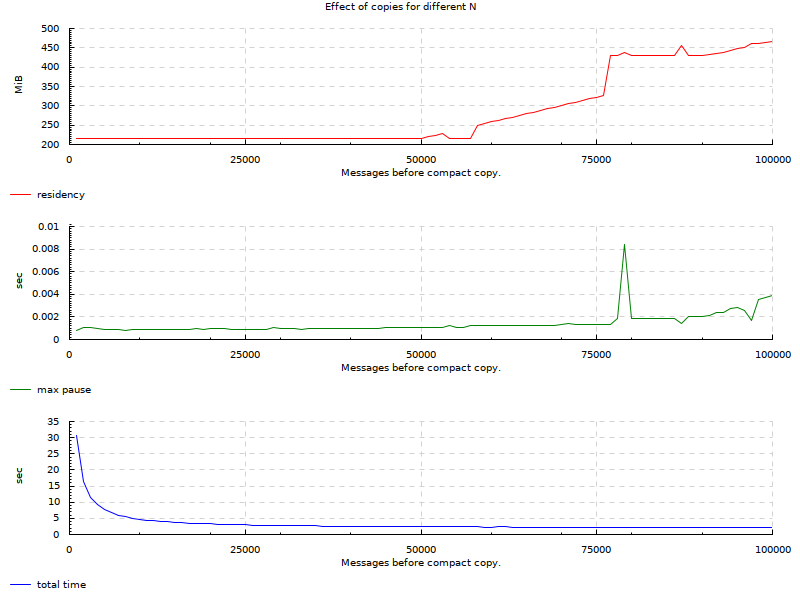
Here is a third run between 1k and 100k as this seems to be quite an interesting region, intervals of 1000:

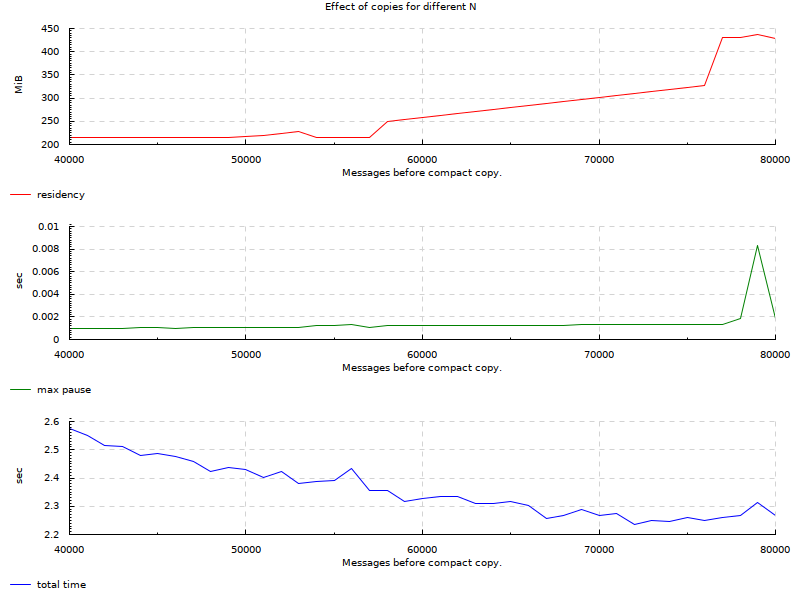
And finally a smallest run between 40k and 80k as this seems to be somewhat of an optimal range for our example.

Conclusion
From the charts, we see that there are areas for this particular use-case where we can keep GC pauses very low. The original requirement was 10ms. Original SO question demonstrated 50ms GC pauses. In the charts we can see many areas below 5ms and ranges where it’s 1-2ms while maintaining relatively low residency and about the same factor of slowdown as when we never collected. On the extreme side where we stored all messages in the region, our pauses go to ~0: we don’t have any real data to traverse so GC doesn’t pause for long.
The throughput is poor. 2x-3x times slower. Part of the slowdown is artificial: I had to make things work with ShortByteStrings, I’m creating those from ByteString &c.
The main issue with this case study is that the buffer of messages changes and we have to manage it, balancing memory vs latency vs throughput. Compact regions really shine when you have a chunk of long-lived data that you want to access throughout your program. I would say that using it with data that’s changing frequently is a poor use. Even then, I’m actually pleasantly surprised: if you can take the 2-3x throughput hit but really care about latency, there is now a light in the tunnel for you. There is also additional memory cost but in a lot of cases if you’re willing to trade throughput, you probably can afford additional residency too.
Of course the very first thing to do would be to try to make-do without this: compact regions are not magic and they have costs and restrictions. They seem to be very good at what they do (based on numbers from the paper) but they are not the silver bullet. If you can exercise some smarter programming to get by, you should do that first.
Lastly, my benchmarks are very poor, I sample each N just once. Some of them were done multiple times as the charts generated were from separate runs. I would not use anything you see here as scientific fact nor a template for how to use compact regions. This was merely me checking out the feature and trying to apply it to an example I knew. I think if I were to re-do this post, I would take the time to set up much more comprehensive benchmarking with multiple versions of code side-by-side, pretty metrics &c.
In the future if I have an application with long-lived mostly-static data, I will certainly keep compact regions in mind.
Appendix
I used the following code to generate the chart seen earlier. This is just throw-away code so it’s just here for completion.
module Main (main) where

import Control.Monad
import Graphics.Rendering.Chart
import Graphics.Rendering.Chart.Backend.Cairo (renderableToFile)
import Graphics.Rendering.Chart.Easy
import Graphics.Rendering.Chart.Grid
import System.Process

data Stats = Stats
  { nVal :: !Int
    -- | MBs
  , residency :: !Double
  , maxPause :: !Double
  , totalTime :: !Double
  } deriving Show

main :: IO ()
main = do
  -- GHC RTS options do not allow you to see max pause in a nice
  -- format. GHC.Stats doesn't return it. It's not in -t
  -- --machine-readable output either. Just "parse" -s output, this is
  -- a throw-away program anyway.
  times <- forM [5000, 10000 .. 1005000] $ \i -> do
    (_, _, out) <- readProcessWithExitCode "/tmp/Main_short" [show i, "+RTS", "-s"] ""
    let ls = lines out
        res = read . filter (/= ',') . head . words $ ls !! 2
        pause = read . filter (/= 's') . last . words $ ls !! 7
        totTime = read . filter (/= 's') . (!! 4) . words $ ls !! 14
    print i
    pure $! Stats
      { residency = fromIntegral (res :: Int) / 1024 / 1024
      , maxPause = pause
      , totalTime = totTime
      , nVal = i
      }
  void $ renderableToFile def "/tmp/results.png" $ fillBackground def $ gridToRenderable $
    let title = setPickFn nullPickFn $ label def HTA_Centre VTA_Centre "Effect of copies for different N"
    in title `wideAbove` aboveN
         [ aboveN
           [ layoutToGrid $ mkChart "residency" "MiB" red [ (nVal s, residency s) | s <- times ]
           , layoutToGrid $ mkChart "max pause" "sec" green [ (nVal s, maxPause s) | s <- times ]
           , layoutToGrid $ mkChart "total time" "sec" blue [ (nVal s, totalTime s) | s <- times ]
           ]
         ]

mkChart
  :: String
  -> String
  -> Colour Double
  -> [(Int, Double)]
  -> Layout Int Double
mkChart lbl units c vs = execEC $ do
  layout_y_axis . laxis_title .= units
  layout_x_axis . laxis_title .= "Messages before compact copy."
  layout_plots .=
    [ toPlot $ plot_lines_title .~ lbl
             $ plot_lines_values .~ [vs]
             $ plot_lines_style . line_color .~ opaque c
             $ def
    ]